


Stone Ridge Christian School in Duluth, Minnesota, recently held an activity day focused on living with physical challenges.
In order to heighten the students’ awareness, and engender sensitivity to the challenges faced by others, they participated in a full day of activities as if they themselves faced those same challenges.
Approximately 37.2 million people in the U.S. in 2017 reported having a hearing disability, 22.9 million reported vision trouble and 18.2 million reported finding it very difficult to walk a quarter of a mile.1 Ten percent of the total world population (roughly 650 million) live with a disability of some sort.2 In 2017, Duluth reported 12.5 percent of its population as physically challenged.3
Rudy Carlson, head teacher at SRCS, added Physically Challenged Day to his regular curriculum in 1996 to bring awareness to these struggles. The objective, he explained, “is for the student to experience a challenge applied to each area of the curriculum. The student then demonstrates his or her empathy toward those who are physically challenged by writing a reaction paper at the end of the day.”
Carlson reached out to the church’s home school population and invited them as well. “Home school and church school are not mutually exclusive, but rather mutually beneficial,” he explained. “We support our home schoolers in every way we can.”
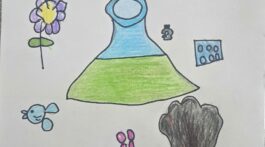
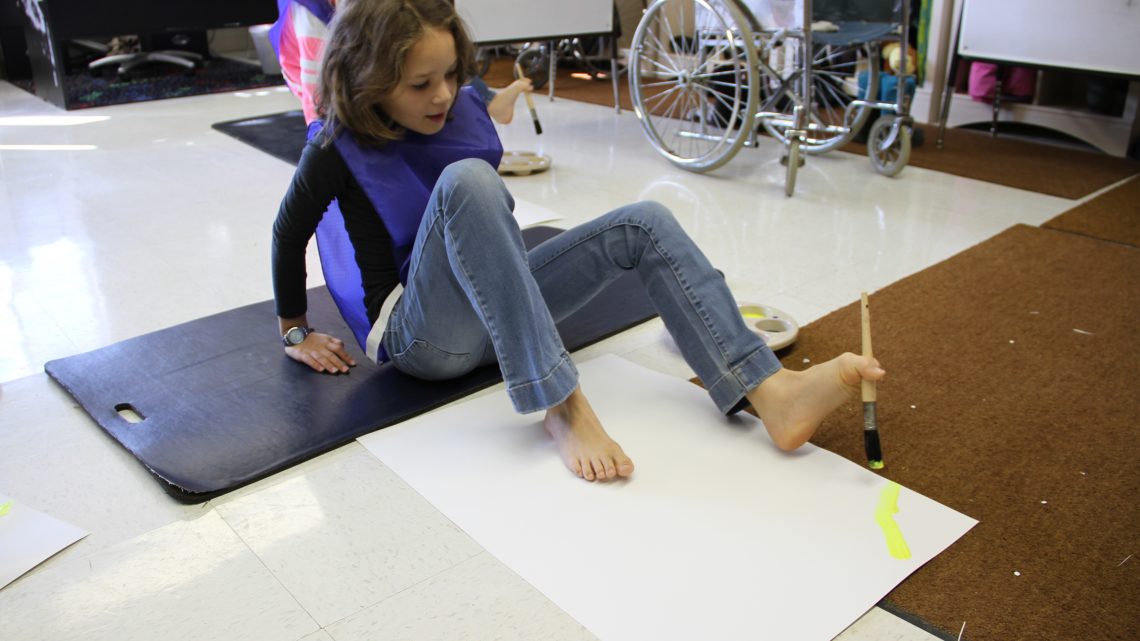
During the day, students learned about the difficulties involved in reading if you have dyslexia, glaucoma or anathropy. In math, they struggled to use a calculator without using their fingers, while art featured painting using feet instead of hands.
Even snack time came with a challenge: to eat everything on a plate and drink everything in a cup while their arms were restrained. This activity came with a prize for the cleanest plate.
Collene Rognlie-Klick is a member of the Duluth Adventist Church and is the Communication Director for Stone Ridge Adventist Christian School.
References:
- “National Center for Health Statistics.” Center for Disease Control and Prevention. 3 May 2017. www.cdc.gov/nchs/fastats/disability.htm
- “Disability Statistics: Information, Charts, Graphs and Tables.” Disabled World. 21 Jan. 2018. www.disabled-world.com/disability/statistics/
- “U.S. Disability Statistics by State, County, City and Age.” Disabled World. 9 June 2017. www.disabled-world.com/disability/statistics/scc.php#city